Process profiler
A simple process profiler. propro can be used in many different ways. Conviniently in can be used on the command line:
$ propro --fmt=png <command>
for more options call:
$ propro --help
Another option is to call the profiling programatically
import propro
x = propro.profile_cmd("ufig --background-type=chunked_map ufig.config.random")
The returned profiling result can than for instance be used for custom plotting.
propro offers the option to profile a single Python function using a decorator
import propro
import numpy as np


@propro.profile(sample_rate=0.1, fmt="txt")
def mem_hungry(size):
    a = []
    for i in range(size):
        a.append(np.random.random())

    b = []
    for i in range(size):
        t = []
        for j in range(size):
            t.append(i * a[j])
        b.append(t)

    b = np.array(b)
The profiling output is stored in the folder where the Python code was launched.
Finally, propro can be embedded in your IPython notebooks. Load the extentsion with
import propro

%load_ext propro
The profiling can be done on line level
%propro -r 0.1 load_pixels(path, PIXEL_COUNT)
or on cell level
%%propro -r 0.1
X = np.random.normal(size=(200,200,1000))
P, D, Q = np.linalg.svd(X, full_matrices=False)
X_a = np.dot(np.dot(P, np.diag(D)), Q)
print(np.std(X), np.std(X_a), np.std(X - X_a))
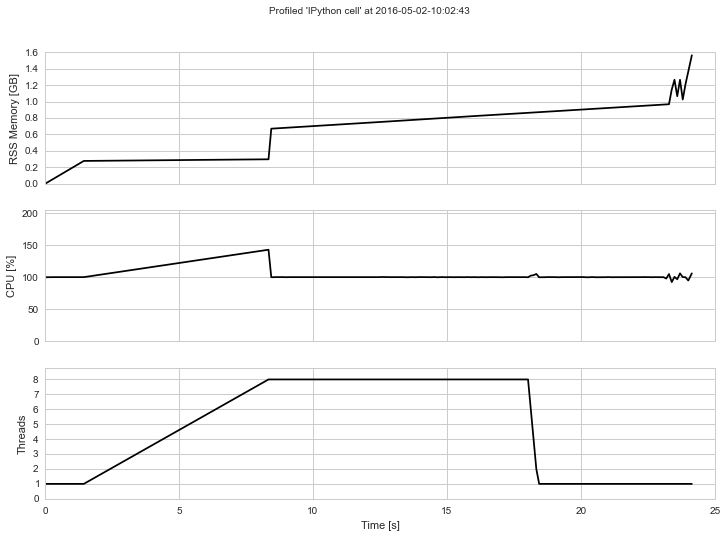
The output will look something like this if rendered into an image:
Contents:
Feedback
If you have any suggestions or questions about Process profiler feel free to email me at jakeret@phys.ethz.ch.
If you encounter any errors or problems with Process profiler, please let me know!